Quite often when I am debugging the performance of a React application, I need to work out why something rendered. However, I frequently forget how to do this, so this is a note to my future self.
Prerequisites
You need to have React Dev Tools installed
Make sure you have the correct settings
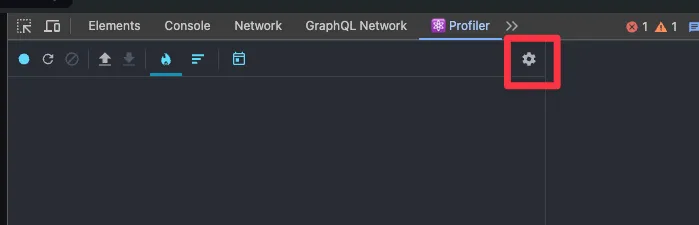
Open up the dev tools and select the Profiler tab. Then hit the settings button found here:
Then you need to go to the Profiler tab inside settings and check this box:
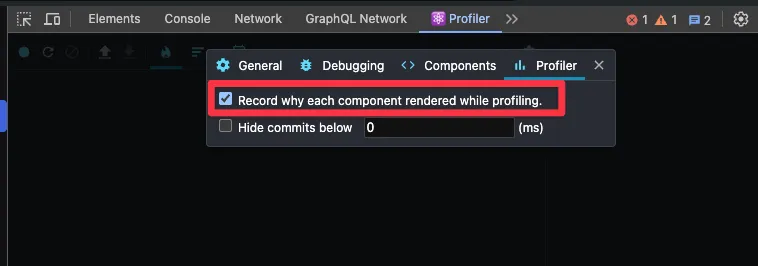
This means that next time you record a profile, it will also record “why” a component rendered if you click on the component in question. However, rather than tell you exactly why it rendered it can be a little cryptic. For example, if it was a hook that caused the render it will say something like hook 12. Let’s go through it.
Recording a profile
The key to recording a profile is to only record the actions your want to analyse. It is often better to keep the actions small - e.g. only opening a modal or clicking a button - so you don’t have a crazy amount of data to work through.
So get to the part of your app where you will record your action, open dev tools on the Profiler tab. When you are ready to go, hit record, execute the action (e.g. open a modal, enter some data, click submit) and then stop recording.
I will do another post on how best to parse all this data but for now let’s focus on how to find our why something rendered.
Click on the component in question and on the right hand side you should see why it rendered:
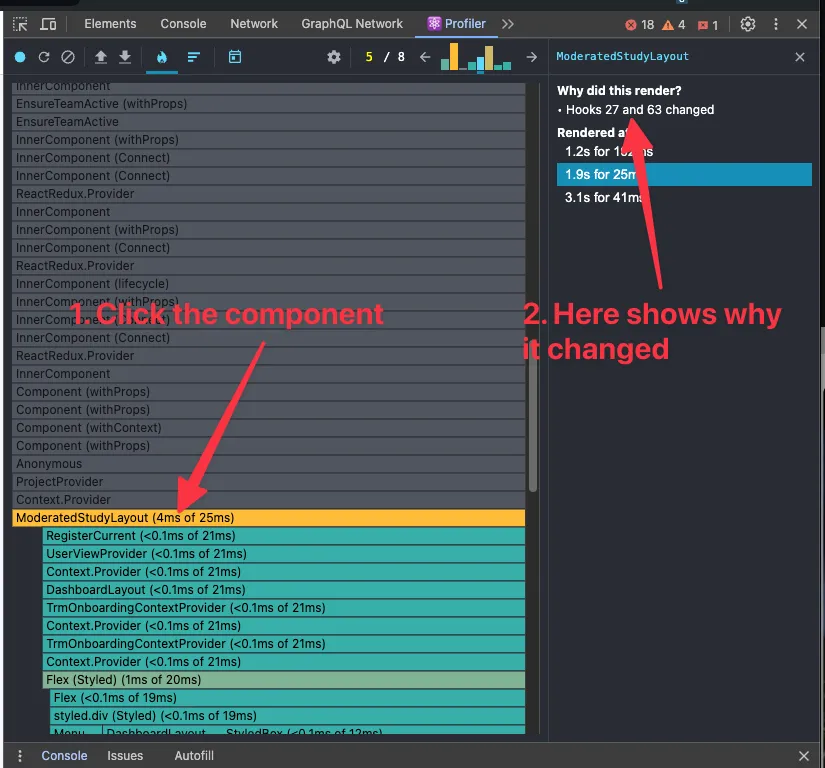
As you can see we have a cryptic “Hooks 27 and 63 changed” which isn’t very useful… yet.
Finding which hook it was
To find out which hooks these are, switch the the Components tab. The component that you had focused inside the Profiler tab should automatically be the focused in the Component tab.
In the right hand panel there is a a section for “hooks”. It’s pretty manual but you can open the tree of objects there until you see little numbers. These numbers are the numbers that we saw in the previous tab so we need to dig around until we find hook 27 & 63.
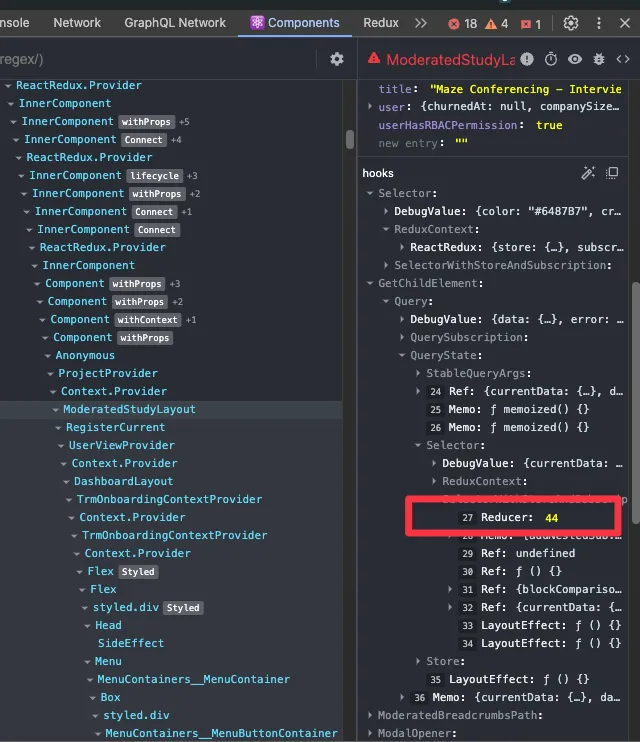
As you can see, in this case it just says Reducer so you have to dig around to work out what this is. In this scenario Reducer is a hook that is inside the Hook useGetChildElement (look up the tree and you can see GetChildElement - it shows you the name with the use prefix)
